Spec on Social Influence
Analysis
Introduction
In
large social networks, nodes (users, entities) are influenced by others for
various reasons. For example, the colleagues have strong influence on oneˇŻs
work, while the friends have strong influence on oneˇŻs daily life. How to
differentiate the social influences from different angles (topics)? How to
quantify the strength of those social influences? How to estimate the model on
real large networks? In this work, we focus on measuring the strength of social
influence quantitatively.
This
document briefly describes the major tasks in social influence analysis and
lists the data sets used for studying this problem. A more
detailed technique report will be available soon. Source codes will also be
available soon.
General
Principle
Several
theories in sociology [1, 2] show that people the effect of the social
influence from different angles (topics) may be significantly different. For
example, in research community, such influences are well-known. Most
researchers are influenced by others in terms of collaboration and citations.
The most important information in the research community are 1) coauthor
networks, which capture the social dynamics of the community, 2) their
publications, which imply the topic distribution of the authors. The key
question is how to quantify the influence among researchers by leveraging these
two pieces.
In
Figure 1, the left figure illustrates the input: a co-author network of 5
researchers, and the topic distribution of each researcher. For example, George
has the same probability (.5) on both topics, ˇ°data
miningˇ± and ˇ°databasesˇ±; The right figure shows the output of our social
influence analysis: two social influence graphs, one for each topic, where the arrows
indicate the direction and strength. As we can see, Ada is the key person on
ˇ°data miningˇ±, while Eve is the key person in "databases". The goal is really
how to effectively and efficiently obtain the social influence graphs for real
large networks.
Generally
speaking, the challenges of computing social influence graphs
are the following:
ˇ¤
Multi-aspect. Social influences are
associated with different topics. E.g., A can have high influence to B on a
particular topic, but B may have a higher influence to A on another topic. It
is important to be able to differentiate those influences from multiple
aspects.
ˇ¤
Node-specific. Social influences are
not a global measure of importance of nodes, but an importance measure
conditioned on a specific node. The data mining researchers may have high
influence on the fellow researchers, while have little influence to the others.
ˇ¤
Scalability. Real social networks
are getting bigger with thousands or millions of nodes. It is important to
develop the method that can scale well to real large datasets.
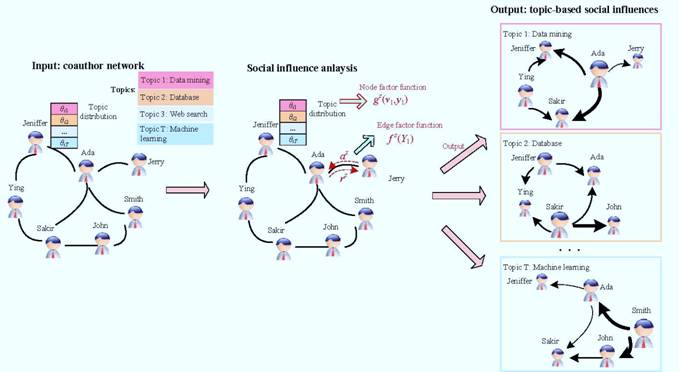
Figure 1. Social
Influence Analysis illustration using the co-author network
Data sets and tools
Currently, we have three data sets.
1.
Author Network: a data set consists of authors and coauthor relationship chosen from ArnetMiner.
ˇ¤
graphs_authors.rar: co-author
network. The dataset consists of 8 topics: Topic 16: Data
Mining / Association Rules, Topic 107: Web Services,
Topic 131: Bayesian
Networks / Belief function, Topic 144: Web Mining /
Information Fusion, Topic
145: Semantic Web / Description Logics, Topic 162: Machine Learning,
Topic 24: Database
Systems / XML Data, Topic
75: Information Retrieval.
Readme: the dataset consists of 8 topics, e.g., graph-T16_xx.net indicates the
data file is for Topic 16. For each topic, there are one or more co-author
networks, e.g., the two files graph-T107_sub1.net and graph-T107_sub34.net
represent that on the topic 107, there are two co-author separated networks.
Each data file, e.g., graph-T16_sub0.net, consists
of three sections: *Vertices, *Edges, and *Triangles.
ˇ°*Vertices 348ˇ± indicates that there are 348 nodes
(authors) in the network.
The lines following ˇ°*Vertices 348ˇ±, e.g., 1
"Sreangsu Acharyya" 4, each represents the attributes of a node, with
three columns: nodeid, person name, #papers.
The lines following ˇ°*Edgesˇ±, e.g., ˇ°293 327 1ˇ±, each
represents an edge between nodes, with three columns: nodeid of the source
node, nodeid of the target node, number of coauthored papers.
The lines following ˇ°*Trianglesˇ±, e.g., ˇ°108,216,149,8ˇ±,
each represents a triangle among three nodes, with three columns: nodeid of node1,
nodeid of node2, nodeid of node3, number of coauthored papers.
2. Citation network:
a data set consists of paper and citation relationship chosen from ArnetMiner.
ˇ¤
graphs_pubs.rar: citation network. It contains 10 topics: Topic 16: Data Mining /
Association Rules, Topic
107: Web Services, Topic
131: Bayesian Networks / Belief function, Topic 144: Web Mining /
Information Fusion, Topic
145: Semantic Web / Description Logics, Topic 162: Machine Learning,
Topic 24: Database
Systems / XML Data, Topic
75: Information Retrieval, Topic 182: Pattern
recognition / Image analysis, Topic 199: Natural Language
System / Statistical Machine Translation.
Readme: the dataset consists of 10 topics, e.g., graph-16.net indicates the data file is for Topic 16. For each topic,
there is citation network.
Each data file, e.g., graph-T16_sub0.net, consists
of two sections: *Vertices and *Edges.
ˇ°*Vertices 348ˇ± indicates that there are 348 nodes
(papers) in the network.
The lines following ˇ°*Vertices 348ˇ±, e.g., 174
"Multi-relational data mining: the current frontiers" 8, each represents
the attributes of a node, with three columns: paperid, paper title, #cited.
The lines following ˇ°*Edgesˇ±, e.g., ˇ°233 234 1ˇ±, each
represents an edge between nodes, with three columns: nodeid of node1, paperid
of node2, #cited (always 1).
ˇ¤
The raw citation data
can be downloaded from here. This is a citation
graph data set. It consists of 2555 papers and 6101 citation relationship. The papers are mainly from 10 research
fields, discovered by an author-conference-topic model and available at http://arnetminer.org/topicBrowser.do:
Topic 16: Data Mining / Association Rules, Topic 24: Database Systems / XML
Data, Topic 75: Information Retrieval, Topic 107: Web Services, Topic 131:
Bayesian Networks / Belief function, Topic 144: Web Mining / Information
Fusion, Topic 145: Semantic Web / Description Logics, Topic 162: Machine
Learning, Topic 182: Pattern recognition / Image analysis, Topic 199: Natural
Language System / Statistical Machine Translation.
o
Each vertex, i.e. a paper, is attributed with
title, year, publication venue, and authors, formatted as "id\t title \t
year \t venue \t authors"
o Each edge, a citation
relationship, is attributed with source paper id, target paper id, formatted as
"source id \t target id \t 1".
3.
Movie-actor-director-writer network: a data set consists
of movies, actors, directors, writers, and various
relationships between them
crawled from http://en.wikipedia.org/wiki/Category:English-language_films.
ˇ¤
newmovies.rar: a heterogeneous network. It contains 10 topics: American film actors, American television actors, Black and white films,
Drama films, Comedy films, British films, American film directors, Independent
films, American screenwriters, American stage actors.
Readme: the dataset consists of a star-director-film-writer network.
Each data file consists of two sections: *Vertices
and *Edges.
ˇ°*Vertices 348ˇ± indicates that there are 348 heterogeneous
nodes in the network.
The lines following ˇ°*Vertices 348ˇ±, e.g., ˇ°0 "Ann Blyth" 6035 starring 1928 births;Living people;American film
actors;American musical theatre actors;American child actors;People from
Westchester County, New York;ˇ±, each represents the attributes of a node, with
multiple columns: noderid, node name, node weight, node type (e.g., star, or writer),
multiple categories (topics) separated by semicolon.
The weight is simply the number of words
introducing the node on Wikipedia. Type and categories are extracted from Wikipedia
pages.
The lines following ˇ°*Edgesˇ±, e.g., ˇ°233 234 1ˇ±, each
represents an edge between nodes, with three columns: nodeid1, node2, (always 1).
The edge indicates that the two node names appear on the same Wikipedia page.
4.
Tools:
ˇ¤
GraphMarker.jar: a tool
to visualize the data and the analyzed social influence result. There are also
several other variant versions which are necessary for visualizing different
networks. If you are interested in it, please contact with Jie Tang.
Demonstration
Based on the social influence analysis, we are
implementing a new feature for academic search, and will release this new
feature in Arnetminer.org system. ArnetMiner is an academic search system,
which extracts the structured academic information from the distributed Web and
currently provides services such as expert finding, expertise
conference/publication search, association search, topic browser, etc. The
system is in operation on the internet for nearly three years and has attracted
users from 180 countries from all over the world.
References
[1] M.
Granovetter. The strength of weak ties. American Journal of Sociology,
78(6):1360¨C1380, 1973.
[2] D.
Krackhardt. The Strength of Strong ties: the importance of philos in networks
and organization in Book of Nitin Nohria and Robert G. Eccles (Ed.), Networks
and Organizations. Cambridge, Harvard Business School Press, Hershey, USA,
1992.
Last updated date: October. 30, 2009, by Jie Tang.